Chandrayaan-2 XSM
Solar X-ray Monitor
Solar X-ray Monitor (abbreviated as XSM) is part of the remote X-ray fluorescence spectroscopy experiment on board the Chandrayaan-2 mission to the Moon. XSM assists its companion payload CLASS (Chandrayaan-2 Large Area Soft X-ray Spectrometer) that measures the fluorescence X-ray spectrum from the lunar surface in determining the surface elemental composition of the Moon on a global scale by providing measurement of the incident solar X-ray spectrum.
It observes the Sun as a star and measures the solar X-ray spectrum in the energy range of 1-15 keV with an energy resolution of ~175 eV at 5.9 keV and a time cadence of one second. The broadband soft X-ray spectra with XSM provides diagnostics of the solar corona at various levels of solar activity from quiescent Sun to large solar flares.
| Energy Range | 1 – 15 Kev (up to ≈ M5 class) 2 – 15 keV (above ≈ M5 class) |
| Energy Resolution | ~175 eV @ 5.9 Kev |
| Time Cadence | 1 second |
| Effective area (on-axis) | 0.135 mm2 @ 1 keV 0.367 mm2 @ 5 keV |
| Field of View | ± 40 degree |
| Filter wheel positions | 3: Open, Be-filter, Cal(Fe-55) |
| Be-filter movement threshold flux | 80,000 counts s−1 (≈ M5 class) |
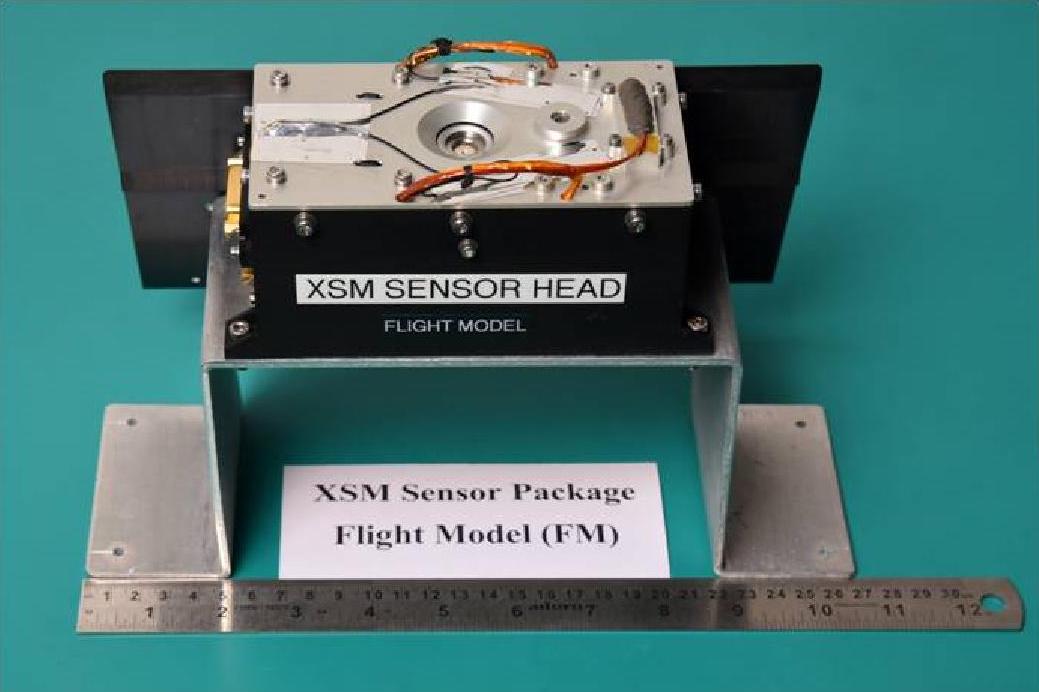
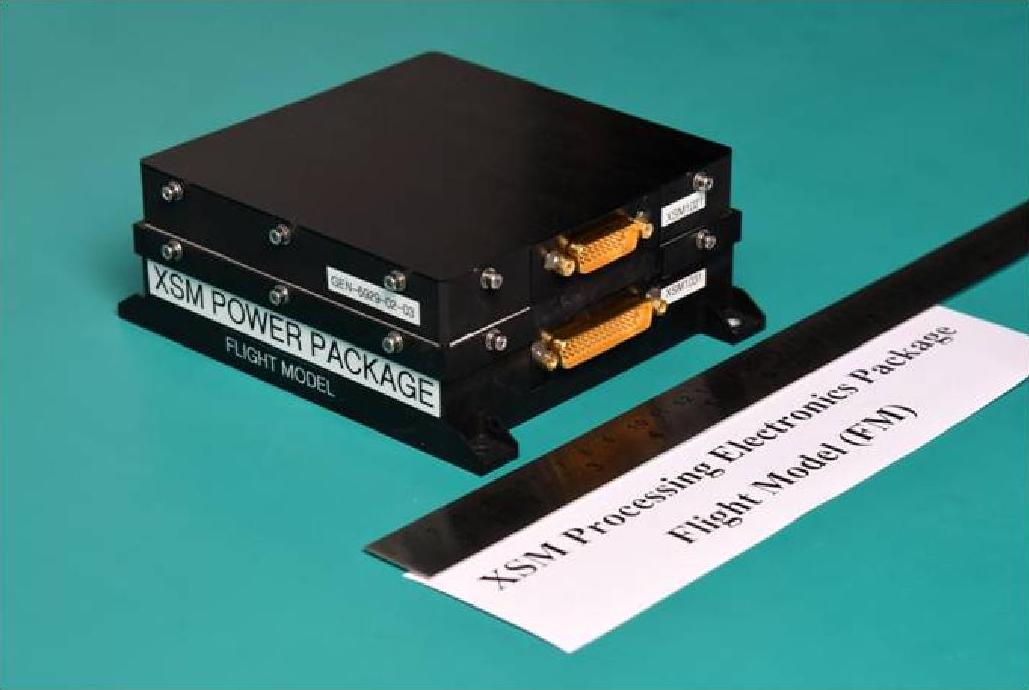
The XSM instrument is designed as two separate packages, namely the XSM sensor package and the XSM processing electronics (PE) package. Block diagram below shows the various components in both the packages and the interfaces between them and those with the spacecraft systems.
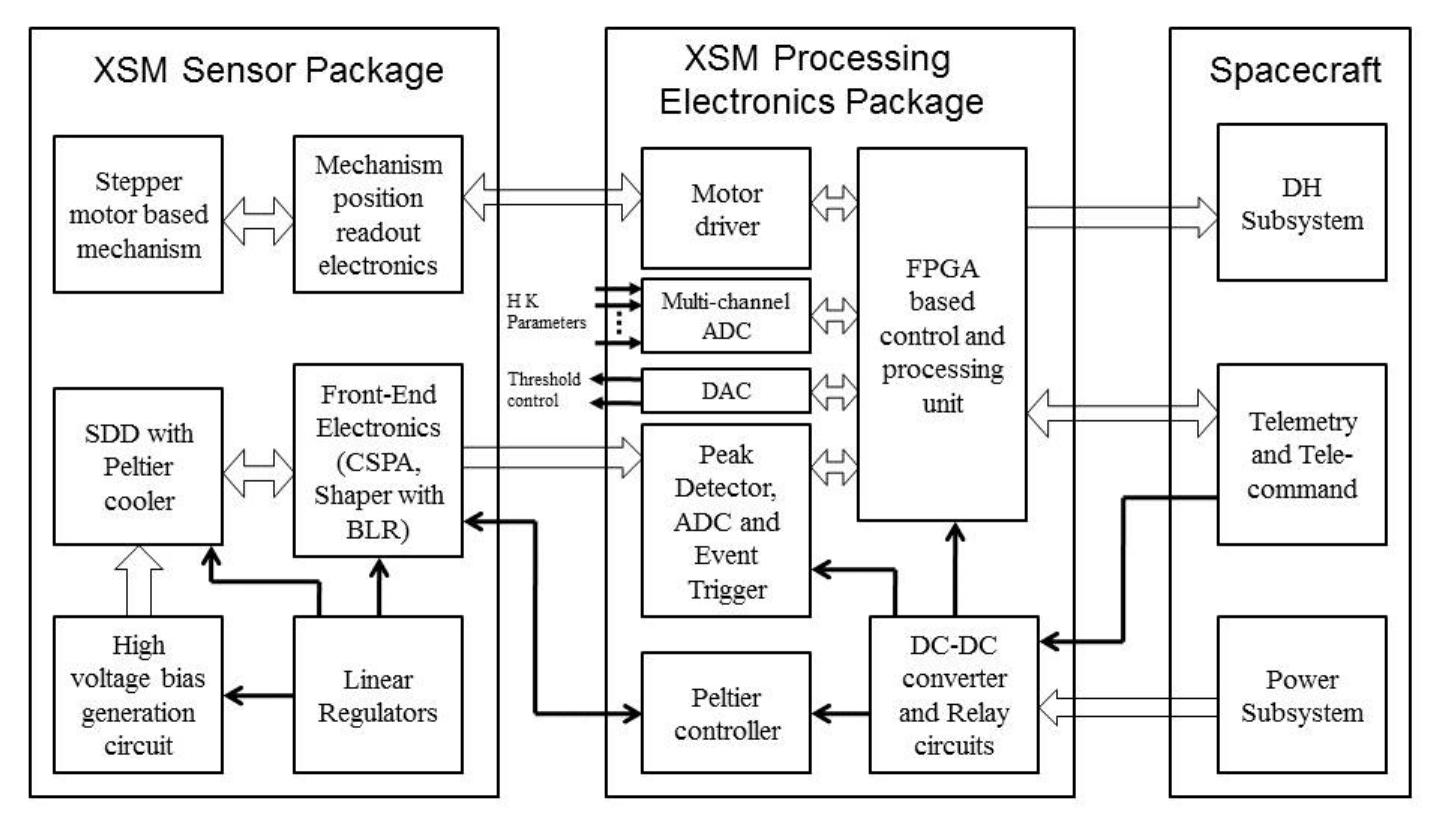
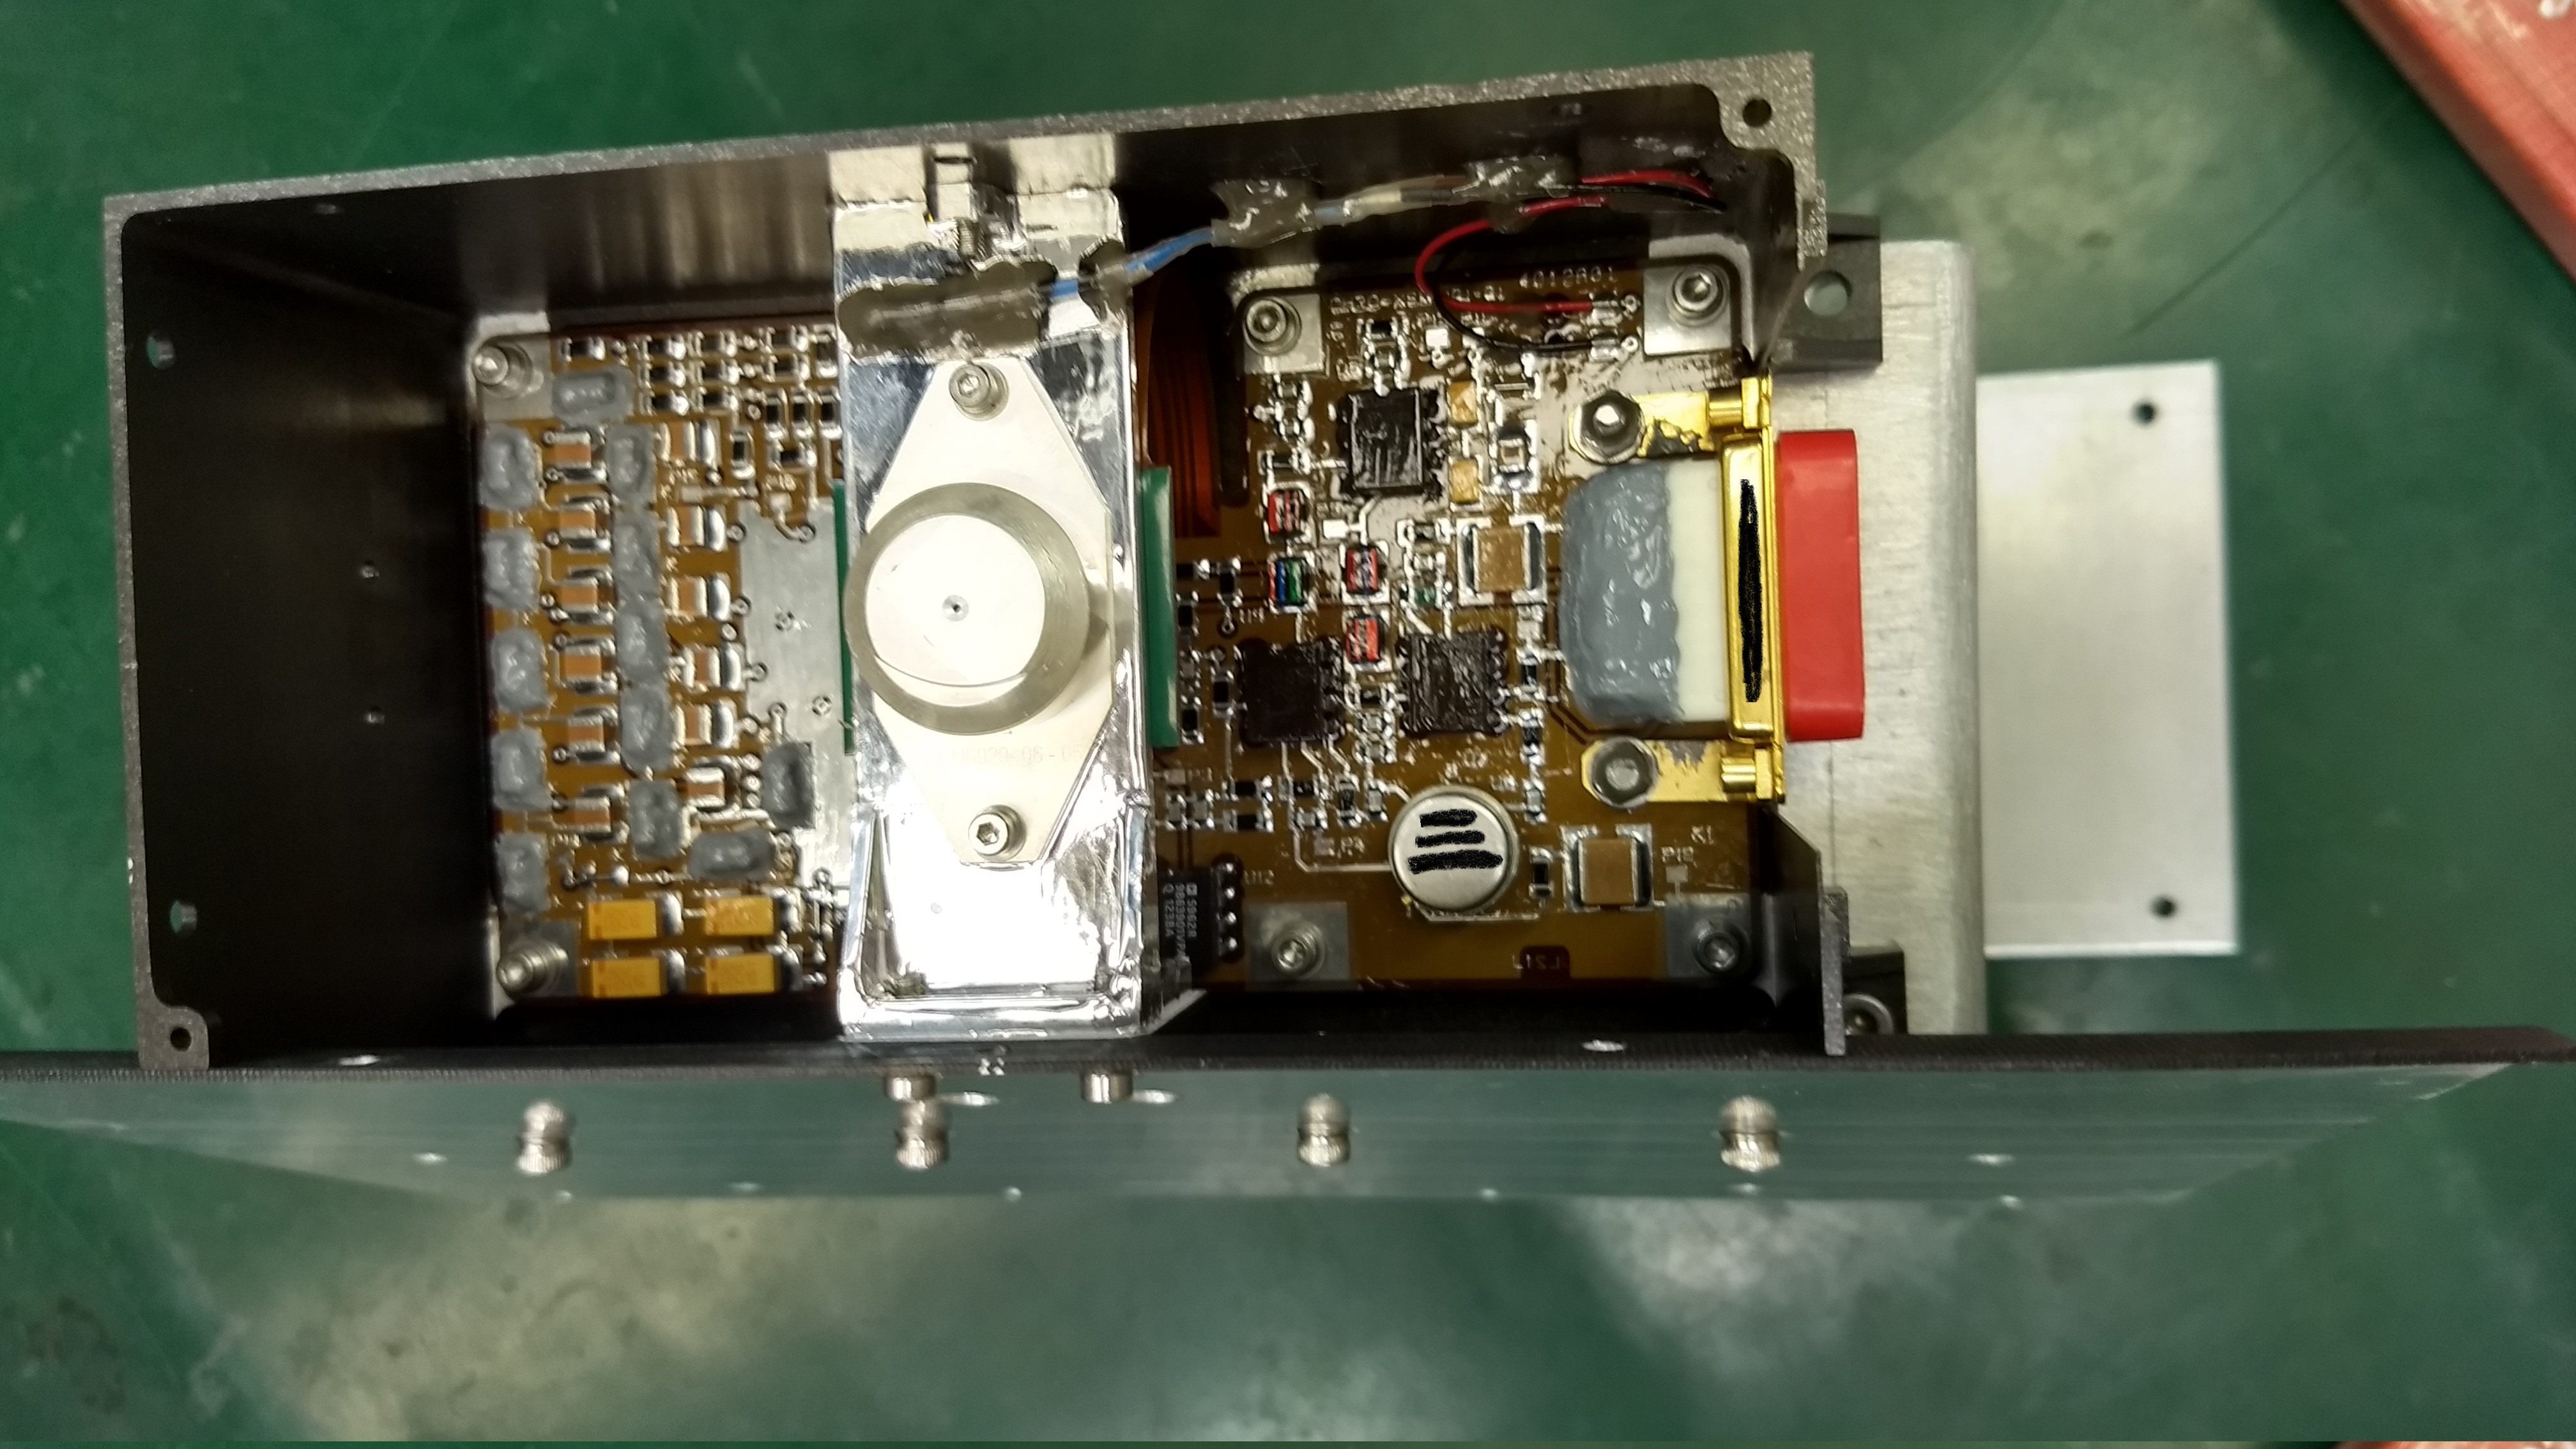
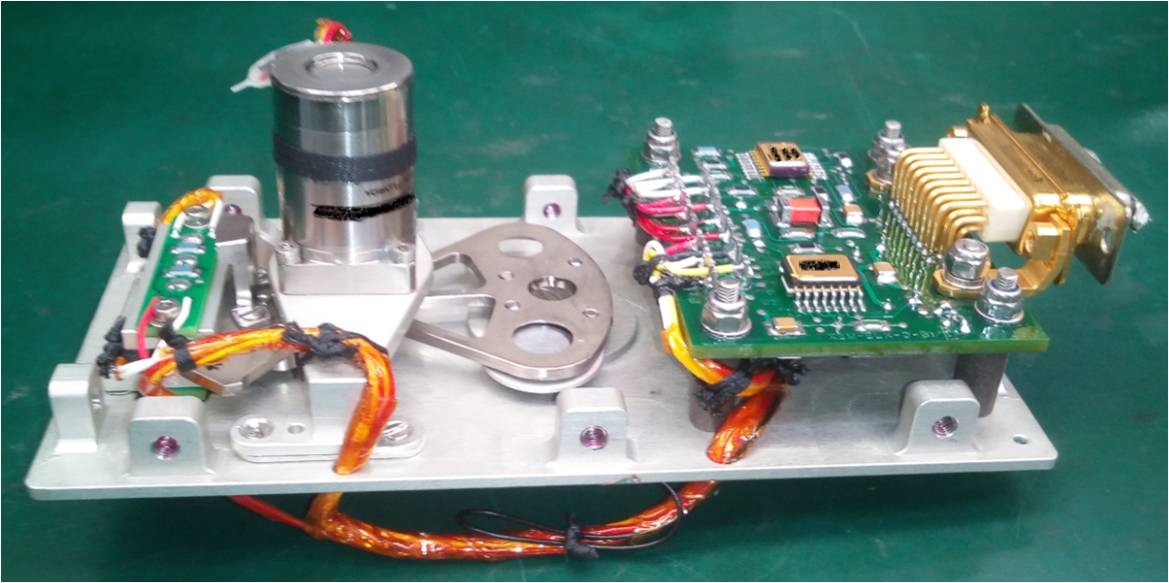
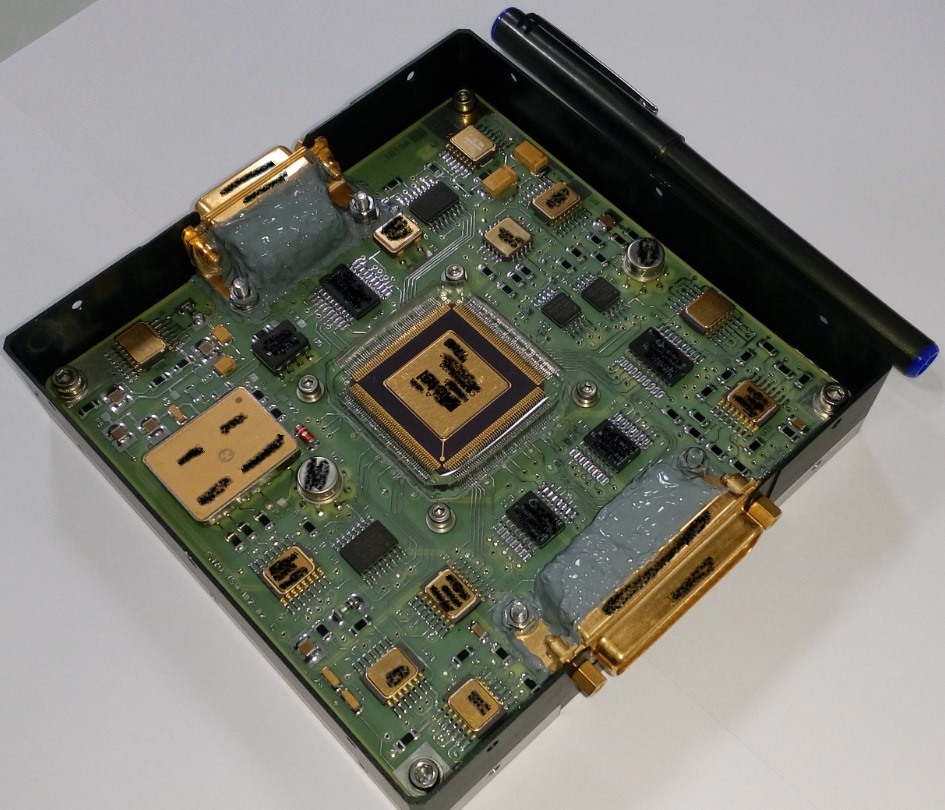
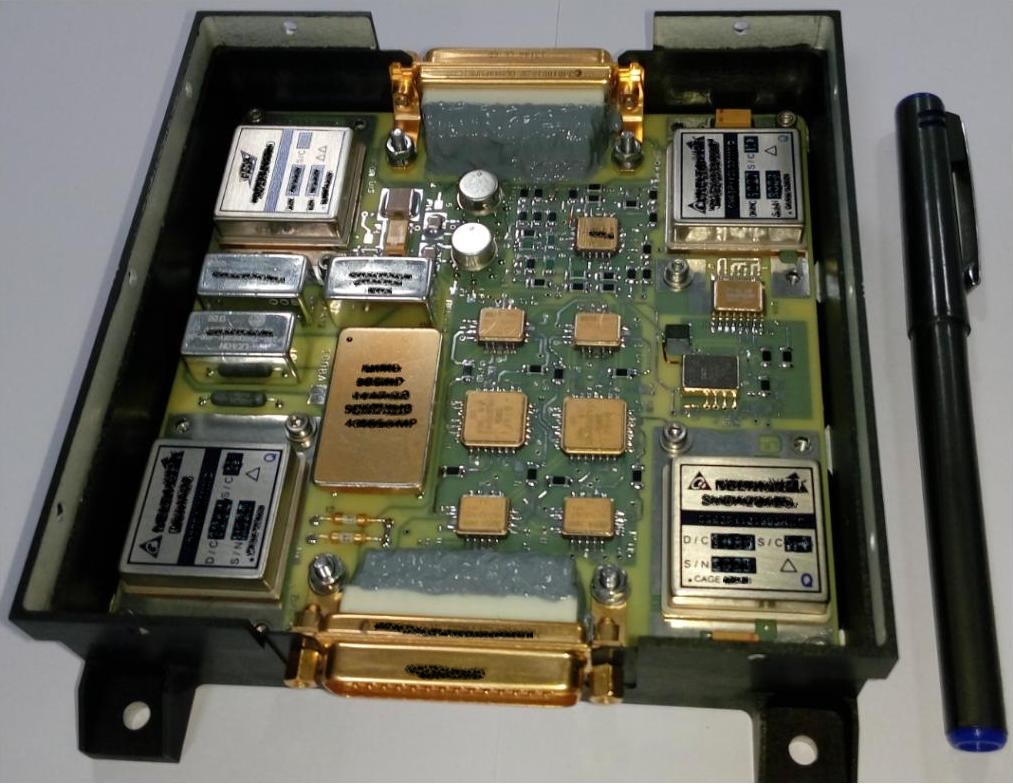
At the heart of the instrument is a Silicon Drift Detector (SDD) housed in the sensor package. X-ray photons incident on the SDD generate a charge cloud proportional to the deposited photon energy, which is collected at the anode of the detector. The front-end electronics, that includes a charge sensitive preamplifier and shaping amplifiers, convert this charge to a voltage signal in the form of a semi-Gaussian pulse. The peak of this pulse is then detected by a peak detector and digitized by a 12-bit analog- to-digital converter (ADC). Histograms of the 10-bit ADC values (ignoring the two least significant bits) are generated at every one second interval and recorded on board. This PHA (Pulse Height Analysis) spectrum at one second is the raw data from the instrument. In level-2/calibrated data generation, the raw PHA spectrum is converted to a Pulse Invariant (PI) channel spectrum of 512 channels of 33 eV width, taking into account the instrument gain, for further scientific analysis.