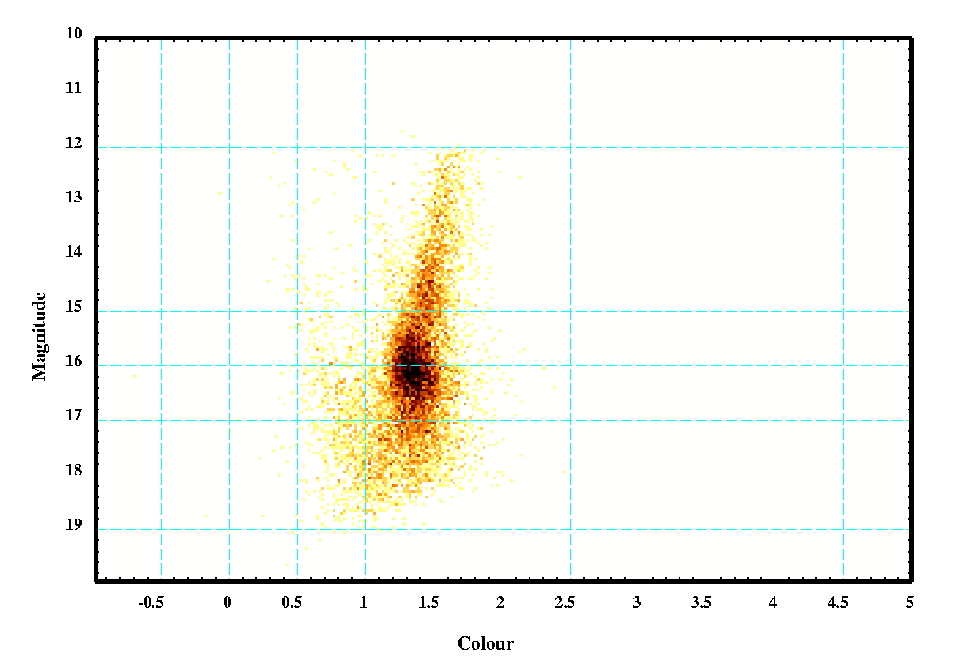
Same colour-magnitude diagram as on this page. But here one of the CMDs (j-h vs h) is shown with a colour coding scaled to show the number of sources per bin of magnitude (0.05mag) and colour (0.02). This was made using the photometric data file run through a python (+pyfits+numarray) script. ds9 was used to display the resultant fits image and to overlay the coordinate grid over it.
This page by SG